


Bitcoin often experiences gigantic price jumps after longer periods of stability. History suggests that now we could see something similar, a major surge soon.
Sick gainz
Bitcoin’s price history shows that after periods of consolidation, there are often big price increases, and tracking Bitcoin’s quarterly prices since 2010 reveals this pattern clearly.
For example, after some stability, Bitcoin’s price jumped from around $16 to $739 at the start of 2013.
In both 2015 and 2017, Bitcoin consolidated around $230 before skyrocketing again, to nearly $20,000 by the end of 2017.
And before reaching over $60,000 in early 2021, Bitcoin stabilized around $10,000 in late 2020.
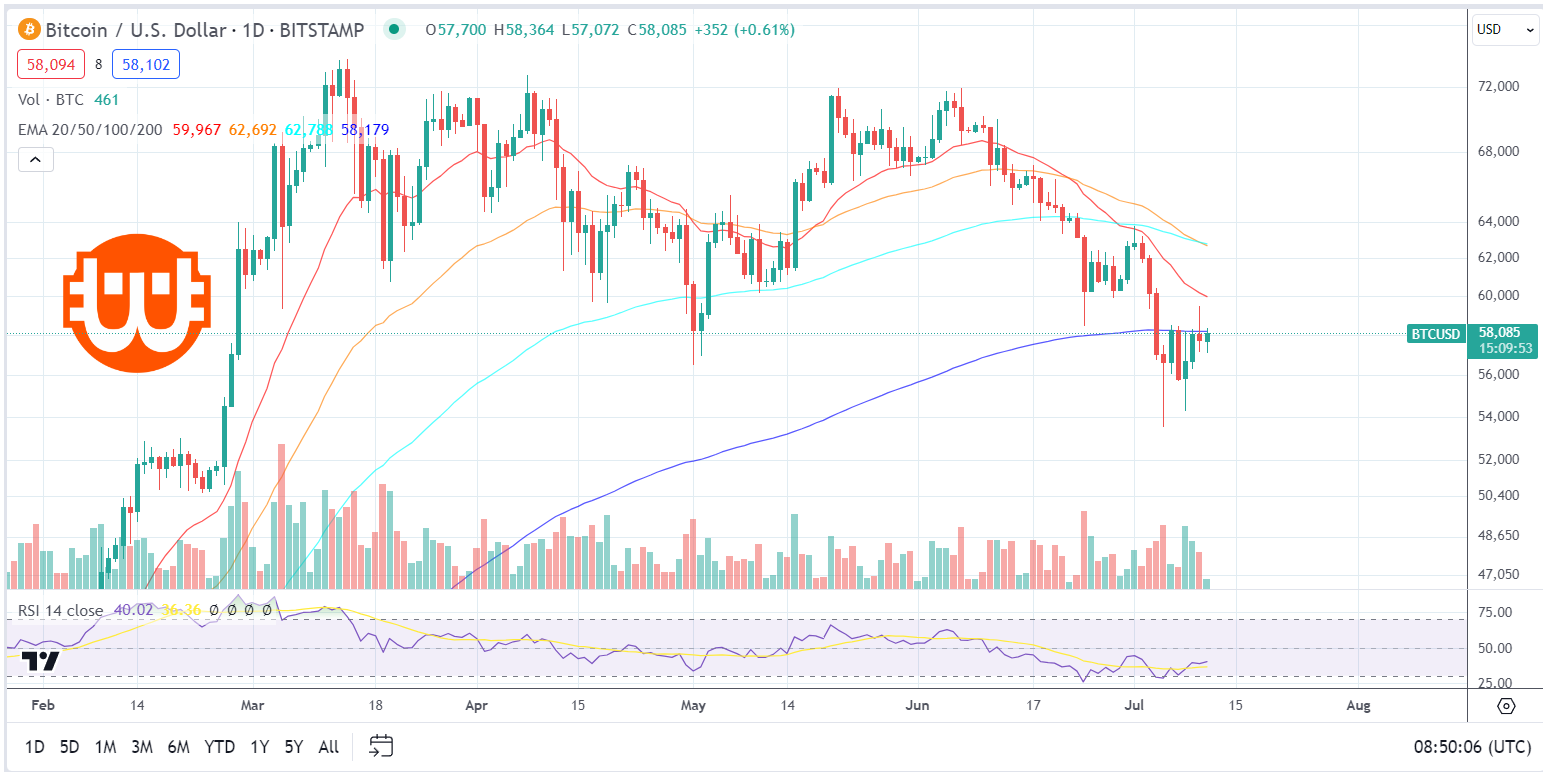
Right now with Bitcoin trading at $58,000 after another consolidation phase, historical trends suggest the possibility of another increase. Well, we’re waiting. Worth to mention an oldschool 50-100x from the current price is very, very unlikely.
The bottom is in?
Focusing on the recent months, a detailed chart of Bitcoin’s daily price movements shows its exponential moving averages at 50, 100, and 200 days flashing positive signals.
After the current selloff, Bitcoin found support at the 200 EMA, which is a potential bottom.
Which means the path lead up. Now trading above the 100 EMA, Bitcoin’s rebound from this level suggests a positive outlook.
God candle when?
The daily chart also shows that trading volume decreased during the downtrend but increased as prices started to rise.
This kind of changes, this volume pattern often marks the end of a bearish phase and the beginning of a new uptrend.
Combining the quarterly historical data with the current daily activity, Bitcoin is pretty much riped for a new rally, a gigantic price jump.
And who knows, maybe we finally get the $100,000 price after an omega candle.
