


A surprising rise in PEPE’s price has caused the largest short liquidation in its history, shaking the market. When the numbers go up, but traders still geting rekt…
Short sellers in disbelief
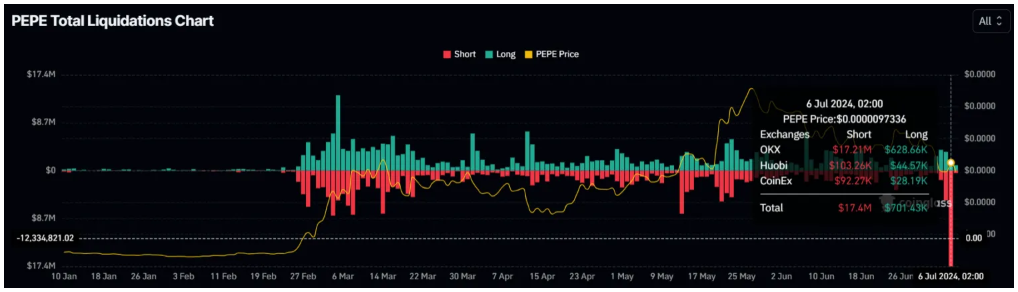
In the past 24 hours, PEPE’s price increased by 9%, surprising many in the market, and the twist in the story is that this rise didn’t signal a recovery but led to huge short liquidations.
Data from Coinglass shows that PEPE saw $17 million worth of short liquidations in just one day, the highest ever for this memecoin.
Bears were expecting the price to drop further over the weekend, but the rise was a blow to them.
Whales feasting
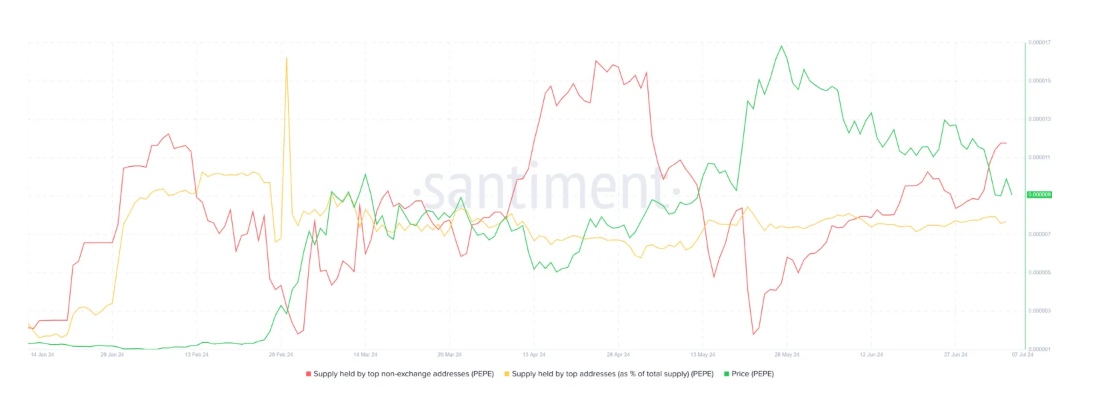
There are also winners, of course, as large investors, whales, saw this as a chance to buy more, and in the last three weeks, these investors purchased over 1.5 trillion PEPE, worth more than $13 million.
They viewed the price decline as an opportunity to accumulate, hoping it would be profitable once the price rebounds.
And based on the cyclical nature of the markets, they might be right.
Earlier this week, PEPE lost its uptrend that had been steady since mid-April, and this break caused the price to drop from $0.00001146 to $0.00000889.
Falling below $0.00001000 was seen as a clear bearish sign, leading many to think the party is over, more red days incoming.
Recovery, short squeeze, or something else?
But the green candlestick from the last 24 hours might be the first sign of a recovery, because if PEPE can turn $0.00001000 into support again, it might rise back to $0.00001146, recovering the losses.
If this doesn’t happen, as there is nothing certain in the market, especially in case of memecoins, the price could fall down to $0.00000775. This would undoubtedly nullifying any remaining bullish outlook.
